
PDFファイルのダウンロードはこちら
[数値データの出典]
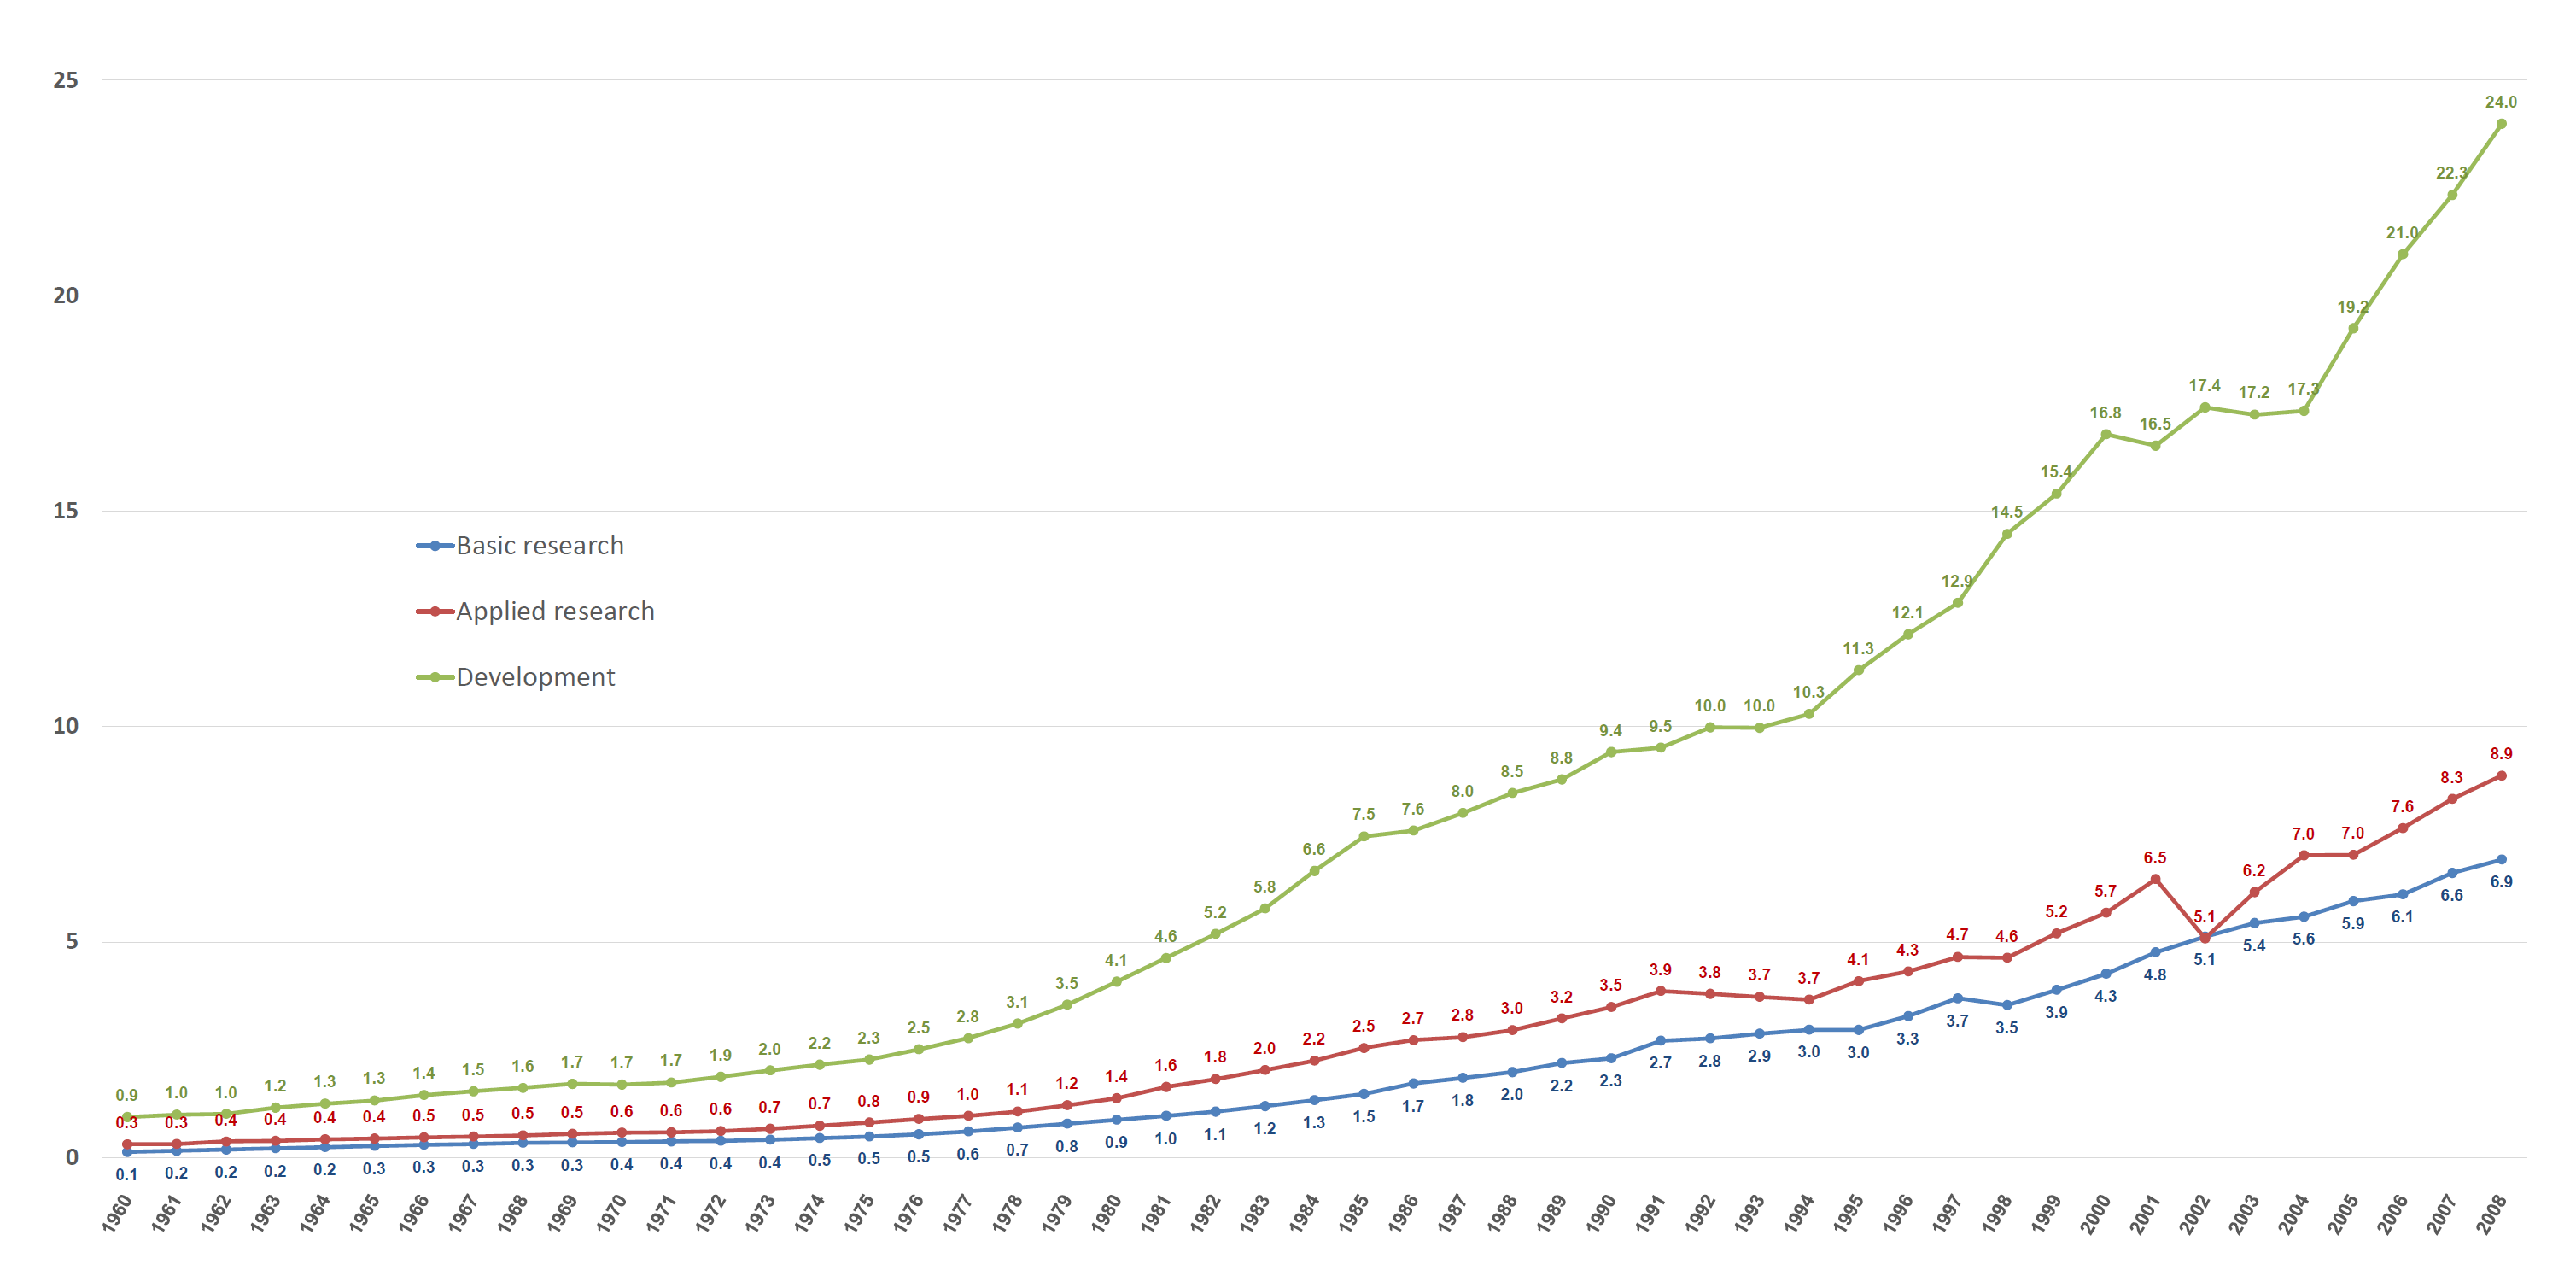
Statistical Abstract of the United States: 2012のSection 16. Science and Technologyの799 – Research and Development (R&D) Expenditures by Source and Objective
https://www2.census.gov/library/publications/2011/compendia/statab/131ed/tables/12s0799.xls
上記エクセルファイルには、研究開発費の源泉別(連邦政府、産業、大学、非営利組織、その他)、目的別(国防、宇宙開発、その他)の数値データも収録されている。
なお元データはU.S. National Science Foundation, National Patterns of R&D Resources, NSF 10-314, 2010.である。
1980-2008のデータは下記にも記載されている。
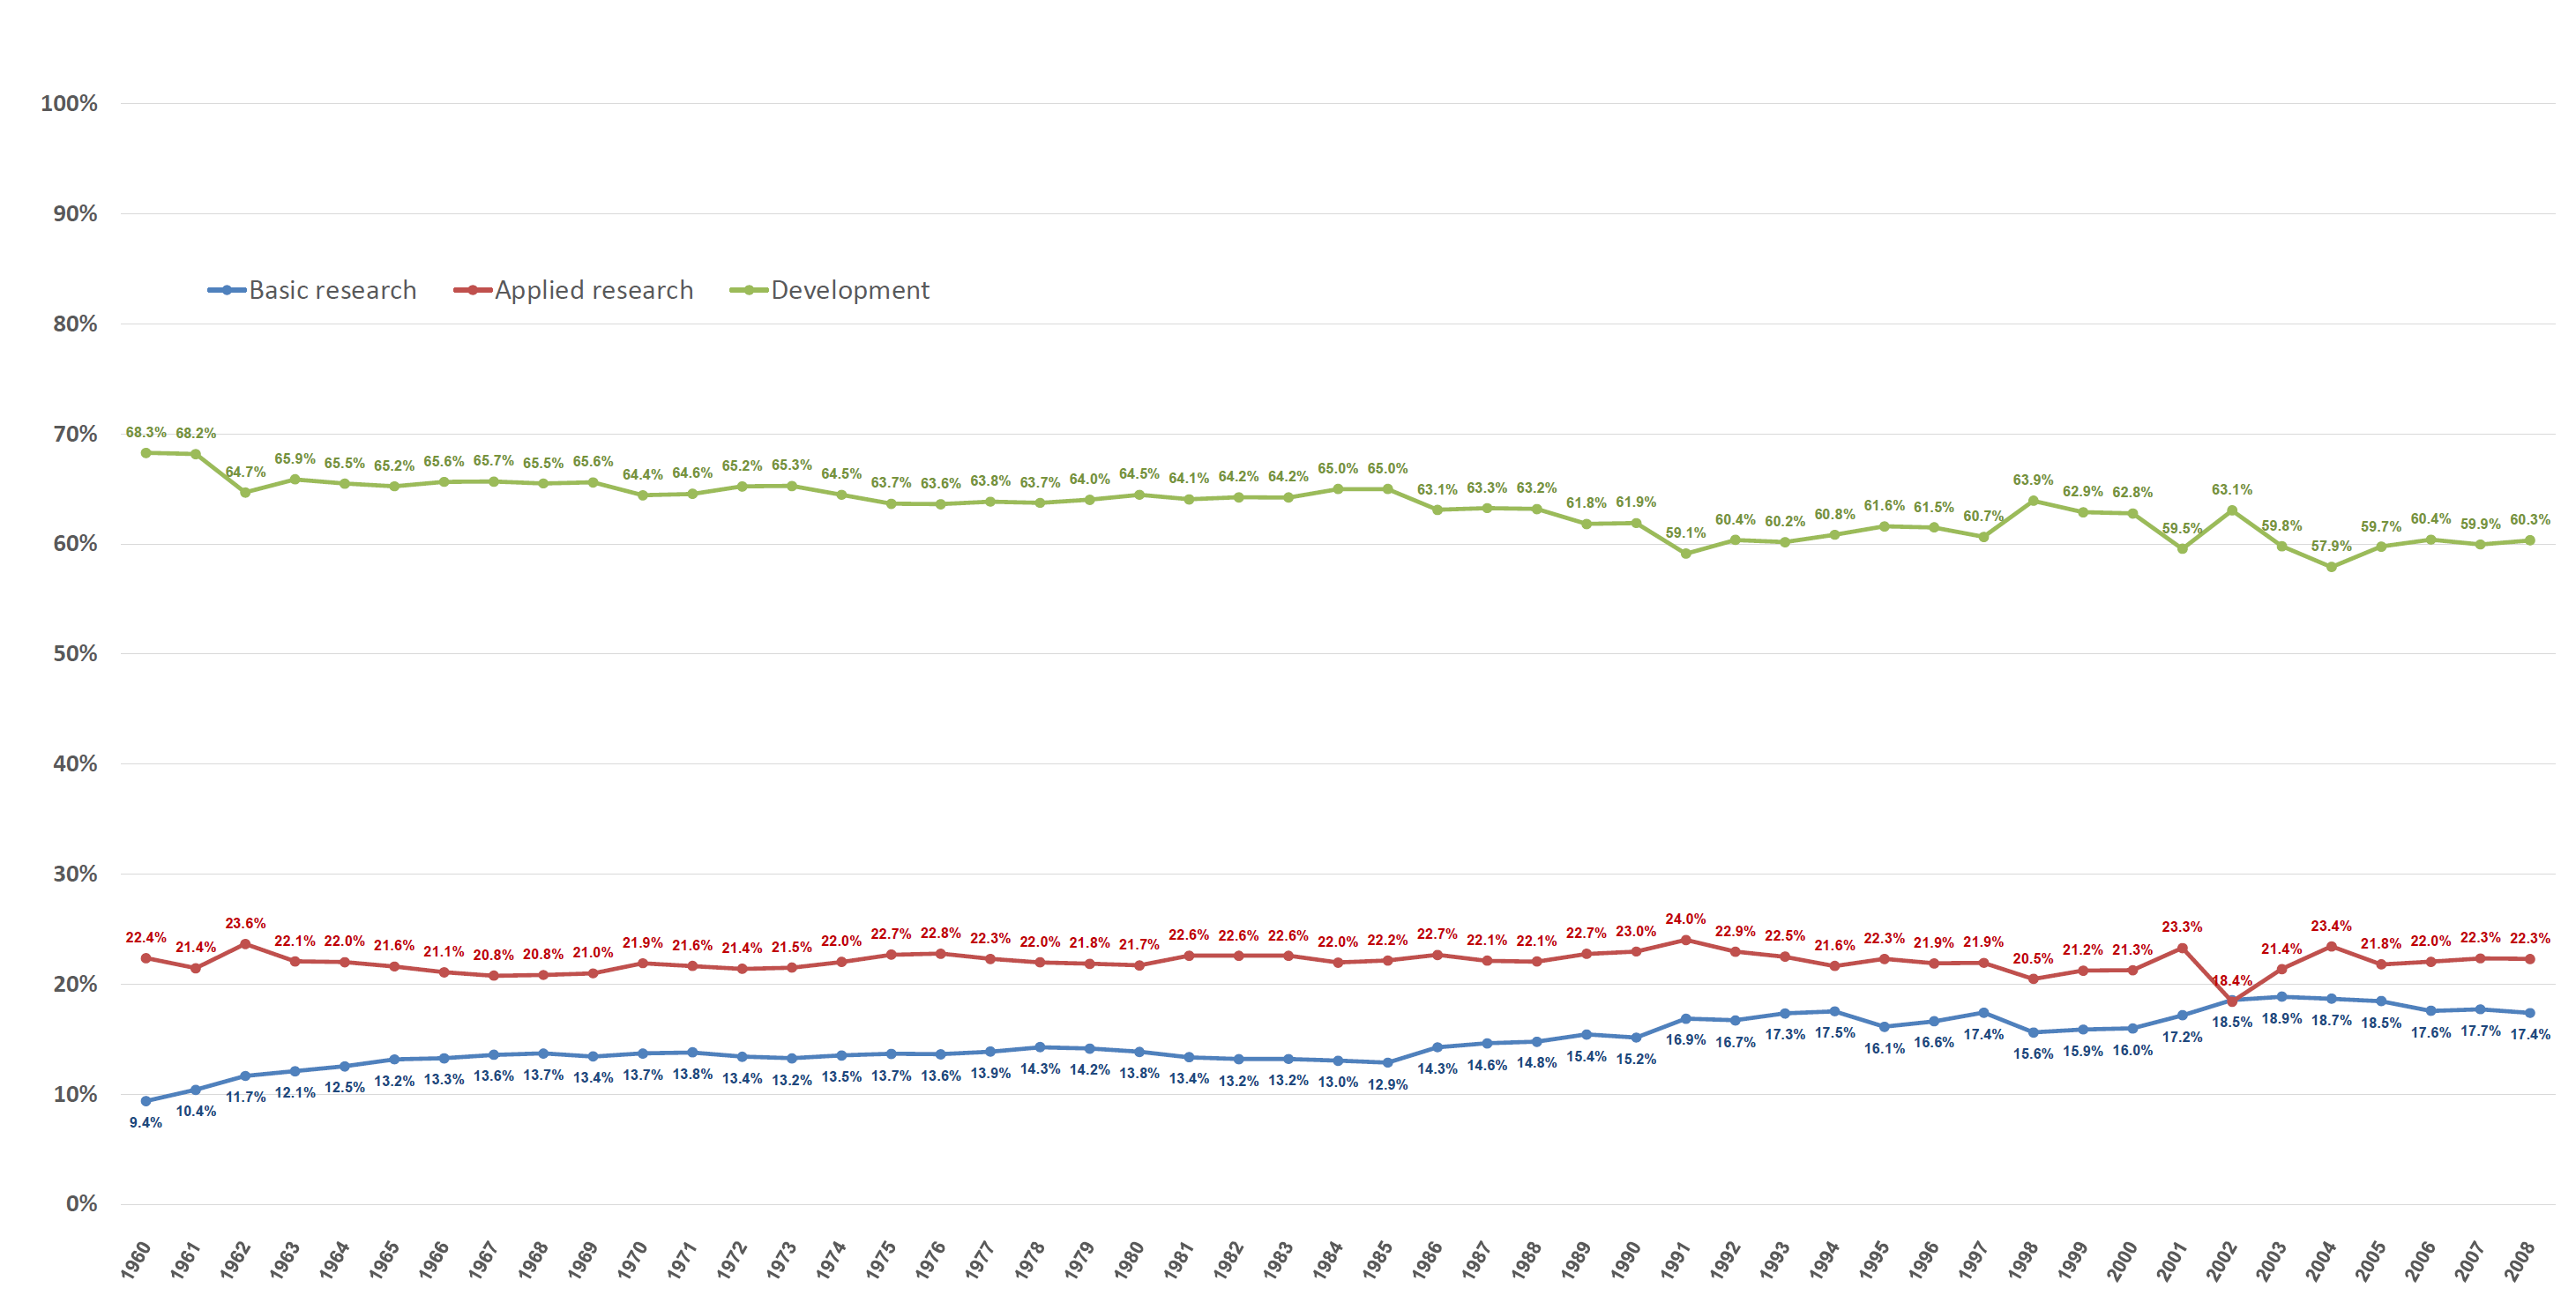
Statistical Abstract of the United States: 2012のp.799の“Table 799. Research and Development (R&D) Expenditures by Source and Objective”
Census.gov > Statistical Abstract of the United States: 2012 > Section 16. Science and Technology
PDFファイルのダウンロードはこちら
[数値データの出典]前記出典に基づき%を算出した。
最近のデータは、The National Center for Science and Engineering Statistics (NCSES)やのWEBページに掲載されている。
例えば下記WEBページのTable4には、U.S. R&D expenditures, by type of R&D: Selected years, 1970–2021が掲載されている。
Research and Development: U.S. Trends and International Comparisons, NSB 2022-5, April 28, 2022